

See more from Canary Media’s “Chart of the Week” column.
The U.S. is the world’s largest exporter of liquefied natural gas — and the war in the Middle East is about to bring massive profits to its gas producers.
As the war destabilizes oil and gas production in the region, LNG prices have shot up globally. Qatar — a U.S. ally and the world’s second-largest LNG supplier — halted production of the fuel on Monday after Iranian drones targeted its energy facilities in retaliation for ongoing U.S. and Israeli strikes. The country accounts for one-fifth of the global LNG supply, and the vast majority of its output goes to Asia.
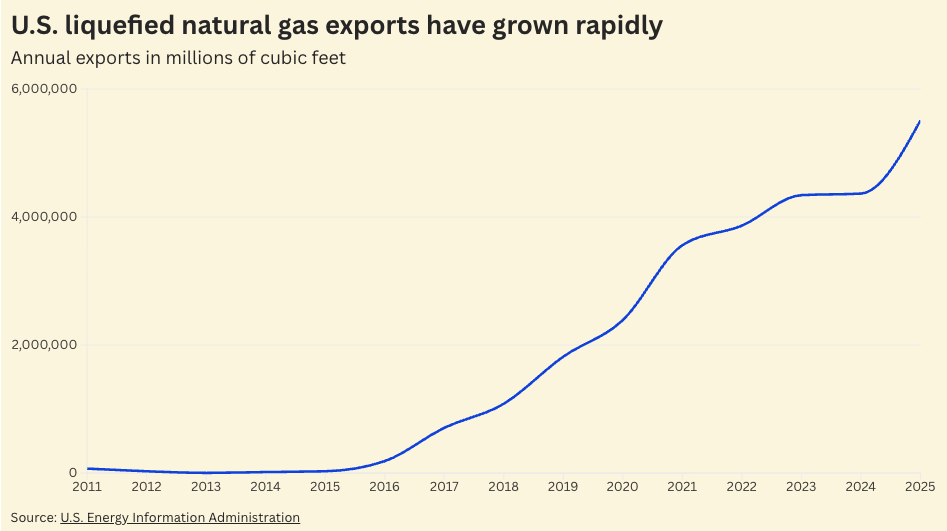
Analysts say American suppliers could be in for a windfall as desperate international buyers bid top dollar to secure what fuel is available. U.S. LNG export terminals are already operating at full bore, so there is unlikely to be a surge in the volume of gas sent abroad — just in the profits firms rake in on each shipment.
Already, the effects of the energy shock are rippling across the world.
In India, the government began rationing natural gas on Tuesday. Meanwhile, Taiwan, which gets 40% of its electricity from LNG and imports heavily from Qatar, said it will take immediate measures that include sourcing more gas from the U.S.
In Europe, natural gas prices have risen less sharply than in Asia but still enough to exacerbate energy affordability problems in the region, which was plunged into an energy crisis following Russia’s 2022 invasion of Ukraine. After mostly quitting Russian gas, Europe has come to rely heavily on LNG from the U.S., though in recent months it has sought to diversify through deals with Qatar and other countries as the Trump administration threatened to annex Greenland.
Since returning to power last January, the Trump administration has pushed to further expand the nation’s lead in LNG exports, despite warnings from analysts that doing so will drive up costs at home. Before the war broke out, the U.S. Energy Information Administration forecast that natural gas prices would climb for Americans in 2027 in part due to expanding LNG exports. The country is already on track to double its LNG export capacity by 2029.
Amid this expansion, Trump has been pressuring allies from Japan to the EU to buy even more U.S. natural gas. But the war only strengthens the case against a deeper dependence on LNG. The more a country relies on shipped-in energy, the more vulnerable it is to global shocks like the one unfolding now.
Renewables, in contrast, are a source of refuge. You install them once and for decades they produce electricity that, though tied to the weather, is completely insulated from global energy markets. Just look at Europe: The region doubled down on wind and solar following the Russian gas crisis, not because of concern for the climate but because of a desire to make its energy system as self-sufficient as possible.
Now, yet another war underscores the perils of relying on imported energy in an increasingly volatile world.
This story was originally published by Colorado Public Radio. Sign up for CPR’s weekly climate newsletter.
Last spring, Occidental Petroleum, an oil and gas company better known as Oxy, began drilling a massive hole in the shadow of a natural gas processing plant south of Greeley.
Drilling rigs are a common sight in Weld County, an area known for producing the vast majority of oil and gas extracted in Colorado. In this case, however, Oxy erected the tower for a different purpose: not to mine fossil fuels, but to tap carbon-free heat roughly 20,000 feet beneath the Earth’s surface.
The project, known as the Geothermal Limitless Approach to Drilling Efficiencies (GLADE), was supported by a $9 million grant issued by the U.S. Department of Energy in 2022. Its goal was to test whether new drilling techniques could reduce the cost and time required to drill superdeep geothermal wells, a potential global clean-energy game-changer.
Oxy has yet to detail its progress publicly and has declined multiple interview requests from CPR News. Its reports to state regulators, however, show that the company completed its drilling work nearly a year ago, working far faster than traditional superdeep drilling projects. The company started drilling in April 2025, digging twin boreholes almost four miles below the surface over less than six weeks, according to state permitting documents unsealed last month.
In a written statement, Jennifer Brice, an Oxy spokesperson, said the project set “new drilling milestones” for Colorado, and the company is now working to assess the experimental project with its academic and government partners.
The results could reveal whether similar projects — or the GLADE project itself — could support a new generation of geothermal power plants. Estimates suggest the bottom of the wells might exceed 450 degrees Fahrenheit. In concept, Oxy could link the bottom of the boreholes, either with additional drilling or by fracking open the surrounding rock. The resulting loop could heat water or another fluid to generate electricity at the surface.
For more than a century, geothermal power plants have been confined to areas with hot springs or volcanic activity, like Iceland or California’s Geysers region. With the GLADE project, Oxy may have demonstrated that fossil fuel companies are well positioned to overcome those limitations. By cutting the cost of reaching high temperatures far below the Earth’s surface, far more communities could harness 24/7, climate-friendly energy available almost anywhere.
“It’s very promising to see an oil company actually jump in with a drill bit instead of standing around thinking about it,” said Roland Horne, a professor of earth sciences and the director of the Stanford Geothermal Program at Stanford University.
Geothermal has long been the sleeping giant of renewable energy.
The resource currently meets less than 1% of global electricity demand, but humanity has only scratched the surface of its potential, according to a recent report from the International Energy Agency. Far more places can now consider geothermal energy due to recent breakthroughs in drilling and hydraulic fracturing developed by the oil and gas industry.
By using the same techniques to tap underground heat, the report estimates that geothermal could meet global electricity demand 140 times over. Unlike wind and solar, geothermal power plants could also fit into compact footprints and supply steady electricity, no matter the weather.
The main constraint is a basic fact about the Earth’s crust: The deeper you dig, the hotter it gets. With wells less than two kilometers deep, the analysis found that only a handful of countries could reach high enough temperatures to make electricity. At seven kilometers, geothermal could be possible in almost any area of the world.
Reaching those depths is difficult but not impossible. During the Cold War, Soviet geologists spent almost 20 years digging the Kola Superdeep Borehole more than 12 kilometers, or 7.5 miles, deep to study the Earth’s crust, setting the record for the world’s deepest hole. In Colorado, a 22,000-foot-deep oil and gas well in Moffat County holds the statewide record, according to a spokesperson for the state Energy and Carbon Management Commission.
Pressure and heat at those depths wreak havoc on mechanical equipment. With the GLADE project, Oxy set out to prove it could overcome those challenges by working faster and more cost-effectively than past superdeep drilling efforts.
The company itself hasn’t released any results, but state records show it dug one of its two wells in 18 days. Horne, the Stanford geothermal expert, said that pace would put Oxy in league with Fervo, a leading geothermal startup that drilled a nearly 16,000-foot-deep geothermal well in southwest Utah in 16 days last year. “That’s pretty impressive,” Horne said.
Other experts have characterized the effort as a success. Amanda Kolker, the manager of the geothermal laboratory program at the National Lab of the Rockies in Golden, said the GLADE project proved it’s possible to dig deep into sedimentary basins, large-scale depressions more commonly explored for oil and gas resources. The Denver-Julesburg Basin is one of many sedimentary basins in the western U.S.
“This achievement could unlock new geographies for geothermal technology deployment in the United States,” Kolker said.
One question is whether Oxy has plans beyond research for its geothermal boreholes. By completing the GLADE project, the company may have taken one of the most difficult steps toward building Colorado’s first geothermal power plant.
Multiple studies show that Colorado has ample underground heat to support a power plant, but no commercial enterprise has built one so far. In central Colorado, a pair of entrepreneurs has spent decades trying to build a geothermal power plant near Buena Vista. Their attempts, however, repeatedly ran into pushback from local residents worried about noise and disturbing the area’s famous natural hot springs. In August 2025, the state land board threw cold water on the idea by declining to renew a key land lease for a potential power plant site.
The Weld County site is rural and surrounded by oil and gas sites, far from hot springs or towns opposed to industrial development. Such a facility would also align with goals outlined by Gov. Jared Polis. Since taking office, the governor has created new geothermal subsidies and streamlined the permitting process for future geothermal projects, including power plants.
It’s unclear whether the company has any intention of building a power plant, but federal scientists advising the project have at least considered the possibility. A 20-page analysis published by the National Lab of the Rockies in 2024 estimates the GLADE project could produce 2.2 megawatts of electricity, enough to power a small community or industrial site.
In 2024, before drilling began, the company also sent a notice to residents, explaining it planned to link the bottom of the wells and circulate water to measure thermal energy. Depending on those results, the document notes, the company hoped to “design a small test plant to generate electricity.”
Brice, the Oxy spokesperson, said the document refers to a “test plant rather than a power plant,” but didn’t explain the difference. She also declined to answer whether Oxy has already built an experimental power plant at the site or plans to in the near future. “No decisions have been made,” Brice said.
If Oxy pursues a power plant, it could hint at a new investment opportunity for Colorado’s oil and gas industry, said Michael Rigby, an energy transition facilitator with the Colorado Energy and Carbon Management Commission. He suspects that oil and gas firms are waiting for a signal — evidence that the same supply chains and workers behind fossil fuels could pivot to geothermal projects.
“There are synergies between oil and gas and geothermal,” Rigby said. “As we see more things happen, I think we will see more merging in that space.”
A correction was made on March 5, 2026: This story originally misstated Roland Horne’s first name as Ronald.
Oregon has made heat pumps the default appliance for cooling new homes.
Last month, the state Building Code Division’s Residential and Manufactured Structures Board voted 7–1 to adopt energy-efficiency standards that encourage builders equipping new homes with air conditioning to use dual-purpose heat pumps instead of conventional central ACs.
The rules could ultimately boost statewide adoption of electric heat pumps, a tech that provides not only cooling but emissions-free heating, too. Heat pumps are 200% to 400% as efficient as conventional gas furnaces, and using them to heat homes is often cheaper than using fossil-fueled appliances.
“The code update is an upgrade in both comfort and affordability,” Eleanor Ponomareff, city council president of Talent, Oregon, said in a statement. “The increased energy savings for new construction will benefit every Oregonian who moves into one of these new homes for years to come.”
Oregon has ushered in the new rules as the Trump administration and Republican-controlled U.S. House of Representatives try to undo or undermine efficiency efforts meant to reduce reliance on fossil fuels and lower energy costs for Americans.
In January, the U.S. Department of Justice sued to block two California cities’ bans on gas hookups in new construction. Last week, the House passed a bill that would limit the Department of Energy’s authority to set energy conservation standards for household appliances. The chamber then green-lit another bill to repeal programs created under the Biden administration to spur broader adoption of heat pumps and energy-saving measures.
Meanwhile, momentum for state and local building standards that embrace electrification with heat pumps is growing across the U.S., according to Ted Tiffany, senior technical lead of the nonprofit Building Decarbonization Coalition. “Today, approximately 25% of the country lives in a jurisdiction that either requires or encourages zero-emission buildings,” he said.
In Oregon in particular, local climate laws and commitments helped set the stage for the new rules, according to David Heslam, executive director of the nonprofit Earth Advantage.
Under state law, standards for new residential buildings need to reduce energy use by at least 60% from the 2005 standards by 2030. Heat pumps will help the state get there, per the Oregon Department of Energy in a letter of support for the rules, which will be phased in starting this October.
In Oregon, where utility rates for more than 1.4 million customers have jumped by about 50% since 2020, the latest building code will reduce the energy use of a typical 2,500-square-foot home by 27% compared with the 2023 version of the code. That cut will result in a savings of $171 per year, the Building Code Division estimates.
To be fair, energy-slashing approaches required under the new standards are expected to increase the cost of building a new residence. But, for that typical 2,500-square-foot structure, the bill savings they generate would allow them to pay for themselves in about 15 years.
This estimate assumes that relevant costs stay fixed. If heat pumps continue to get cheaper and more efficient, or if piped gas prices continue to grow faster than electricity prices, the savings could be even greater.
Oregon building code staff pointed out before the board voted at the Feb. 18 meeting that the new rules aren’t a mandate to adopt heat pumps. They don’t require all homes to have air conditioning — and thus to put in the clean-heat tech. Developers can moreover choose to install gas furnaces with ducted AC units, so long as they meet the updated efficiency standards, which are measured by energy-use intensity.
“But it’s going to cost more to build that home [to comply with the code] because heat pumps are so much more efficient,” said Jonny Kocher, building regulations lead at think tank RMI.
Under the updated rules, heat pumps also don’t need to be sized to cover a home’s total heating demand but rather its typically smaller cooling load. A fossil-fuel furnace could still be used as a backup heating source, for instance.
With its latest building standards, Oregon joins California, Colorado, New York, and Washington in encouraging superefficient heat pumps in new homes. (New York has delayed enforcement of its all-electric buildings code while the law mandating it is in litigation.)
Energy-efficiency standards that encourage heat pumps appear to be working, Kocher noted. For example, the Northwest Energy Efficiency Alliance found that when Washington moved from its 2015 code to the stronger 2018 code, permits for electric space heating in single-family homes rose from 20% to a whopping 88%, with heat pumps accounting for 81% of those permits.
The three West Coast states are “building a market for heat pumps,” which could ultimately help drive costs down, Kocher said.
Still, states could push their regulations further, he noted. Most of these efficiency efforts have focused only on new construction, even though major renovations and additions also fall under building codes’ purview.
There’s one notable example that could prove instructive: When California updated its energy-efficiency standards in 2024, it was the first in the nation to include a provision that commercial building owners replace broken ACs with heat pumps. The state stopped short of extending that concept to homes, but at least 13 California cities have since adopted such rules.
Washington state could be the first to encourage ACs to be replaced with heat pumps in existing buildings when it votes on its code update later this year, according to Kocher.
Developers often don’t have an incentive to install efficient equipment in homes; they’re not the ones paying its energy bills, he noted. But building standards help redress the imbalance, reducing health- and planet-harming pollution — and saving residents money in the long run.
Nearly three years ago, Vermont passed a landmark law that aimed to cut greenhouse gas emissions by shifting residents away from using fossil fuels to heat their homes and businesses. Last month, that plan officially died before ever being put into action — and the path toward cleaner heating in the state is murkier than ever.
In May 2023, Vermont legislators passed the Affordable Heat Act, which is widely considered the first law to require the development of a statewide clean heat standard to lower emissions from heating sources. But after years of contentious debate and recent inaction from lawmakers, regulators closed the case in February, possibly for good.
More than one-third of Vermonters rely on furnaces and boilers fueled by oil — one of the dirtiest and most expensive home-heating sources — and about another 20% primarily use propane. Though the clean heat standard did not mandate a switch to electric heat pumps, the policy would likely have spurred greater adoption of the appliances, which are cleaner and cheaper to run.
Some see the clean-heat turnaround as a financial victory for Vermonters, while others see it as a frustrating loss that will only hurt residents and the planet. How, though, did the pioneering plan manage to fizzle out before it even got started? The answer is a mix of complicated politics, an even more complex policy design, and interference from out-of-state conservative groups.
“There ended up being an enormous amount of misinformation floating around about it, which was very frustrating,” said state Sen. Anne Watson, a Democrat/Progressive who voted for the law. “When people are not circulating well-vetted info, that doesn’t serve anybody — that just serves to scare people.”
Vermont has set a legally mandated target of reducing greenhouse gas emissions 80% from 1990 levels by 2050. Almost all the electricity generated in Vermont comes from renewable sources, including hydropower, solar, and biomass, but the state is still heavily dependent on fossil fuels for heating and transportation. That’s where the clean heat standard came in.
A clean heat standard, broadly defined, is a policy mandating that providers of heating fuels steadily lower the emissions associated with their operations. It’s an adaptable approach, said Richard Cowart, a former Vermont utility regulator and a principal at the nonprofit Regulatory Assistance Project, which advises governments on clean energy policy. Each state implementing such a standard will make its own rules about what kinds of clean energy to include, how quickly to transition, and what fuels to target for reduction.
“It leaves choice in the hands of building owners, homeowners, small-business operators,” Cowart said. “It allows some creativity in implementation and flexibility in the way programs can be rolled out.”
This vision has sparked interest in several other states, but is hitting some obstacles. Colorado in 2021 passed a law requiring natural gas distributors to create clean heat plans. Massachusetts’ Department of Environmental Protection has a clean heat standard in the works, but Democratic Gov. Maura Healey recently delayed the implementation until 2028. Another six to nine states have expressed interest in or have begun exploring the concept, but nothing else is on the books, Cowart said.
Vermont’s idea was to create a “market-based system” in which fuel dealers would obtain a certain number of clean heat credits each year. Credits could be generated by installing weatherization upgrades or heat pumps, or by selling fuels with lower emissions; dealers could offer these services themselves or buy credits from other entities doing that work. Either way, the system would have helped pay for a less emissions-intensive heating system across the state.
The standard’s political foundations were never unshakable. The first shot at establishing the policy occurred in 2022. The heavily Democratic legislature passed a bill creating a clean heat standard, but Republican Gov. Phil Scott vetoed the measure. An attempt to override the veto fell one vote short in the state House.
In 2023, a bill was again passed and again vetoed. This time, the veto override succeeded by one vote in the Senate. Part of the deal that helped the legislation pass was a provision that required regulators to design the program and then bring it back to lawmakers for another vote before it could be implemented.
“That was pretty unusual,” Watson said. “Usually, you design a program, then the rules take effect, basically, immediately.”
Lawmakers never had a chance to take that second vote.
Regulators released their program design and cost estimates in 2025. Those intervening years gave opponents time to build their case against the program. Their main argument: The clean heat standard would dramatically raise prices for any Vermont household still using heating oil, as sellers would pass their compliance costs on to customers. Scott’s administration repeatedly claimed the plan could increase heating oil prices by up to $4 per gallon (for comparison, current prices average $3.65 per gallon), though the basis of this number was never clear.
While the numbers weren’t available until 2025, utility regulators ultimately calculated that the program would cost residents a total of about $956 million in its first 10 years of operation and provide societal benefits of $1.5 billion. The average price of heating oil would go up an estimated 8 cents per gallon in the beginning, rising to 58 cents in 2035. But those using heat pumps could expect to save some $500 per heating season on fuel costs compared with burning oil, or to save over $1,000 compared with using propane.
Shortly before the bill passed, Americans for Prosperity, a national conservative policy advocacy group founded by oil-industry billionaires Charles and David Koch, arrived in the state as part of an effort to expand its work into traditionally left-leaning states. In May 2024, it launched a direct-mail campaign attacking the clean heat standard and inaccurately complaining that the policy would put severe restrictions on natural gas, impose a tax on heating oil, and mandate the installation of heat pumps in homes.
“We were not having a full and fair and accurate conversation about the costs and the opportunities the program could deliver,” said Johanna Miller, energy and climate program director for the Vermont Natural Resources Council.
Then came the 2024 election. In historically deep-blue Vermont, Scott was reelected and 22 legislative seats flipped from Democratic to Republican, eliminating the supermajority that had enabled the veto override the previous year.
At the time, there was widespread concern in the state about property tax increases related to education funding. Republicans took advantage of this ongoing financial unease to inflate and mischaracterize the costs of a clean heat standard, said former state Sen. Chris Bray, a Democrat and major force behind the clean heat standard bill, who lost his seat in the election.
“It got weaponized in the campaign season, with a broad misinformation campaign,” Bray said.
The highly detailed work of designing the clean heat standard created its own complications.
In February 2024, state utility regulators issued the first mandated progress report on their efforts and noted that most participants in the process — including the public utilities commissioners themselves — had “serious misgivings” about whether a thoughtful and effective policy could be put together on the timeline dictated by the law.
The complexity of the program came up again and again. Commenters noted that the standard was difficult for average Vermonters to understand, and extensive education and outreach efforts would be needed. Others suggested that cost and confusion would drive small fuel dealers out of business, leaving consumers with fewer choices and potentially higher prices.
“We opposed this not because the idea wasn’t good, but because the execution was fatally flawed,” said Matt Cota, a lobbyist for fuel sellers who was a member of the Clean Heat Standard Technical Advisory Group.
Even the regulators who designed the standard ultimately advised against adopting it. In a January 2025 report, the public utility commissioners concluded that “the Clean Heat Standard is not well suited to Vermont.” A more effective choice, the commission said, would be to expand upon existing programs, such as the fee that generates revenue for electric-efficiency programs.
In the face of a likely gubernatorial veto, and the recommendations from the commissioners, even those lawmakers who still believed in the policy saw no way forward
“It was the chastened legislature that was unable and unwilling to pick it up and go further,” Bray said.
Lawmakers say the clean heat standard, in the form passed in 2023, is unlikely to be introduced again. Some supporters of the standard worry that further action is unlikely as long as Scott is governor. But advocates of the underlying ideas think some program to incentivize greenhouse gas reductions from heating is necessary and inevitable, even if it is not a fast process.
“That’s going to come back, because it’s something that we know has to be achieved,” Cowart said. “Over the course of a generation this work is going to get done.”
Essentially everyone agrees: Americans shouldn’t pay higher electric bills to feed AI data centers’ insatiable demand for power. But what will it actually take to prevent cost spikes?
Lots of states have decided the answer is a “large load tariff” — an unsexy term that basically translates to special utility rates and requirements designed for huge energy users, like data centers.
As of late 2025, more than 65 such tariffs have been proposed or approved in over 30 states, according to data tracked by the Smart Electric Power Alliance and the North Carolina Clean Energy Technology Center.
These efforts are largely trying to solve the same problem: The explosive growth of AI data centers is outpacing utilities’ ability to build power plants and upgrade the grid. If data centers don’t show up and stick around to buy all the power that’s justifying those investments, other customers could be trapped paying them off for decades to come.
This puts enormous pressure on regulators to “hold the line on ensuring that these large-load customers carry the costs that they bring,” said Jay Griffin, executive chair at the Regulatory Assistance Project. The nonprofit last month launched a report series to help regulators and policymakers navigate these complexities.
The trend of states adopting data center–focused large load tariffs began to take off in 2024, led by early movers like Ohio and Indiana. More such tariffs were approved in Kansas, Michigan, and Virginia last year, and now Illinois and Wisconsin are debating their own proposals. With roughly a year and a half of data on how different states have tackled the problem, “there’s enough time and transparency into decision-making that commissioners are able to make appropriate decisions,” Griffin said.
Progress is decidedly mixed, said Louisa Eberle, a senior associate at the Regulatory Assistance Project who co-wrote its first data center report. “Some are just getting started. We haven’t reached full ‘best practices’ anywhere — but we have found better practices.”
Those start with contracts requiring these giant new customers to pay a minimum amount of money for power for a set period — usually 10 to 15 years — whether or not they end up being built or staying open that long. This offers some insurance against data centers pulling out and leaving customers at large holding the bag, although some advocates fear those terms aren’t lengthy enough to cover the cost of power plants and grid investments, which must be paid off over decades.
Some tariffs also lay out what kind of power such massive customers must use — namely, clean energy. These can match up nicely with both state climate targets and the clean energy goals of the tech giants, like Amazon, Google, Meta, and Microsoft, that are driving the AI boom — although plenty of utilities and data center developers are going big into fossil gas–fired power as well.
And on the cutting edge of large load tariff policy, some utility regulators are asking data centers to “bring their own” generation or grid capacity, Eberle said. The idea here is to make developers play a more active role in sourcing and contracting for new energy resources for their computing facilities. That might not be utilities’ favorite option, since it cuts into the profits they earn from investing in power plants and power lines. But it’s an opening for data center developers willing to pay a premium to get onto the grid faster.
These negotiations aren’t easy, Griffin said. Tech companies are asking utilities to invest billions of dollars to serve power demand equal to that of entire cities springing up on their grids over just a few years. The sheer scale and speed of the boom have overwhelmed regulatory processes built for slow and low growth.
And the future is highly uncertain. Tech companies keep upping their AI spending plans, even amid mounting signs that the sector is a bubble about to pop. The Trump administration’s call in recent months for data centers to build their own power plants as a means to protect utility customers from rate increases conflicts with hard limits on how quickly new generation can be built and connected to the grid.
As the former chair of the Hawaii Public Utilities Commission, Griffin knows that regulators are constantly balancing the risk of letting utilities build too much power with the risk of preventing them from building enough. The former threatens to burden customers with unnecessary costs, while the latter can constrain economic growth and even endanger grid reliability.
Right now, public opposition to data centers is squarely focused on the financial and environmental dangers of overbuilding. Laws passed in Minnesota, Oregon, and Texas last year, and bills being debated in states including Florida, Georgia, Illinois, Virginia, Washington, and Wisconsin, propose everything from stripping tax breaks for data centers to imposing full-on construction moratoriums.
However, data centers that cover their costs and finance more-sustainable resources could help in “reducing cost for everyone,” Griffin said, both by increasing utility revenues to cover shared expenses and by pushing “innovation for emerging technologies,” such as virtual power plants and on-demand clean energy resources like geothermal power. Tech giants “have the demand for power and the need for speed to drive those in a way we’re probably not going to see for another generation,” he said.
While no two large load tariffs are exactly alike, many share common characteristics, as think tank RMI highlighted in a November review.
About a third of the 65 large load tariffs on deck as of late 2025 require big customers to make minimum payments over a set period of years, whether or not they remain operational over that time. More than half include some form of collateral requirements or other credit risk protections. And roughly half require large customers to pay fees if they exit their contracts early.
These requirements can help cull the speculative data center proposals now crowding utility interconnection queues, whether from companies with projects that are highly unlikely to win financing or from major developers “shopping” single projects across multiple utility territories. American Electric Power’s Ohio utility, for example, saw its large load pipeline drop from 30 gigawatts to 13 gigawatts after it instituted a large load tariff last year. In that sense, “not only do strong tariffs help protect customers, they also help the utility in forecasting what’s coming,” Eberle said.
But the tariffs might not be sufficient to pay off the cost of power plants and grid investments that last for decades, said Ben Hertz-Shargel, global head of grid edge at research firm Wood Mackenzie. Last year, he ran an analysis that found none of the large load tariffs on the books at that time were sufficient to fully recover the cost of new gas-fired power plants that would need to be built to serve big energy users.
The scale of fossil fuel build-out being contemplated to serve the high side of the AI bubble would be ruinous on both cost and climate terms. The Sierra Club is tracking a startling 248 gigawatts of gas-fired power plants being planned across the U.S. as of the first quarter of 2026, nearly five times the amount planned in 2021. Data center expansion is the primary driver of that increase, including for build-outs planned in Georgia, Louisiana, and North Carolina— states that have yet to impose large load tariffs.
“There are some utilities that are starting to creep up and charge for what it takes to build a new power plant today,” Hertz-Shargel said. “But it’s still uneven.”
Nor can tariffs guarantee that data centers will pay for transmission built to accommodate their impact on regional grid networks, he said, since those costs are allocated via complex structures that make it hard for utilities to force expenses on individual customers. The Illinois attorney general’s office has raised that issue in challenging utility Commonwealth Edison’s proposed transmission service agreements for data centers.
Even tariffs specifically designed to force individual data centers to cover the costs of utility investments expose customers to financial risk, said Jeremy Fisher, principal adviser on climate and energy with the Sierra Club’s Environmental Law Program.
He cited Wisconsin, where utility We Energies has proposed two tariffs meant to isolate the cost of building power plants and transmission grids to the gigawatt-scale data centers being planned in its territory. Those tariffs allow data centers to pay for new solar, wind, and battery storage. But they also offer an option for the facilities to contract for power and capacity from two gas-fired plants that the utility is planning to build. Under that latter option, everyday customers would remain responsible for paying for 25% of the cost of building these plants, as well as for the fuel they burn.
Meanwhile, two of the planned data centers in We Energies’ territory will consume as much power as the utility’s entire residential customer base, Fisher noted. “I don’t know how you quantify the concentration risk of two customers doubling the size of your load,” he said. “We’ve never seen anything like this.”
Hertz-Shargel added that the risk of a handful of customers driving most new demand is compounded by the nature of AI growth. The sector is fueled by hundreds of billions of dollars of debt financing and circular deals that could unravel if one or more major players fail to deliver.
“If the utility is going to have half of its assets caused by and paid for by a small number of customers, you need to be very concerned about that level of business risk,” he said.
That’s why Hertz-Shargel and other clean energy advocates are pushing a solution adopted by only a handful of utilities and regulators so far: requiring data centers to contract for their own clean energy and capacity.
The concept goes by many names — one of the catchiest is BYONCE, for “bring your own new clean energy.” But Hertz-Shargel uses the term “clean transition tariff,” a phrase coined by Google and Nevada utility NV Energy for a tariff approved by state regulators last year. That agreement allows the search giant to directly tap a geothermal plant being built by startup Fervo Energy.
Last week, Google announced a plan with Minnesota utility Xcel Energy that expands on this premise. Like Google’s agreement with NV Energy, it is a one-off deal rather than a tariff that applies to other large-load customers. But under it, Google will pay for the construction of 1,400 megawatts of wind, 200 megawatts of solar, and 300 megawatts of energy storage, and cover the grid infrastructure costs to bring it all online. It will also invest $50 million in the utility’s proposed Capacity*Connect distributed battery program.
“All parties should love it,” Hertz-Shargel said. “Data center companies get to choose the generation technology that supplies them, generation developers can play in new markets, and utilities get to sleeve the agreements between them.”
Utilities that profit from building power plants may not be as enthused, he conceded. But they already have enormous investments to make in distribution and transmission. “Adding on power plants to serve data centers would add additional revenue, but at enormous political cost,” he said.
Utilities can also squeeze more clean capacity out of the existing grid, Eberle noted. That could look like improving energy efficiency, paying customers to use less power when demand is high, and leveraging rooftop solar systems and home batteries to ease strain on the grid. These strategies “can be scaled up quickly and cheaply,” and they “will be useful even if the load doesn’t emerge,” she said.
Data centers could also agree to strategically reduce their own power use when the system is strained or to install batteries that can relieve near-term grid pressures.
How can large load tariffs tap into this kind of clean and flexible capacity? Fisher highlighted last year’s settlement agreement between Kansas utility Evergy, which has some significant data center projects in its territory, and groups including the Sierra Club, the Natural Resources Defense Council, Google, and the Data Center Coalition.
The tariff allows data centers to earn credit for flexibility they contract directly, Fisher said. But it also gives them the option to contract for renewables, energy storage, or efficiency programs in Evergy’s integrated resource plan, the regulator-mandated process to determine the mix of new power plants and programs the utility can invest in.
That’s an important wrinkle on the “bring your own” concept, Eberle said. It allows data centers to “engage with the utility and say, ‘We really like this resource that you identified but didn’t select — we’d like to pay for it.’”
Another option under the tariff would allow Evergy to seek out and directly charge a developer for the capacity needed to allow a data center to come online, she noted.
Griffin highlighted that these kinds of collaborative agreements take more time and require concessions from utilities and data center companies alike. But “you’ll be more successful if you give commissioners and stakeholders time and space to do the vetting — and that should support the more sound business models,” he said.
As for data center developers trying to push their costs onto consumers, Griffin said, “the more you force commissions to stick their neck out — well, you don’t get that pass many times.”
A clarification was made on March 4, 2026: This story has been updated to clarify that the Smart Electric Power Alliance’s data on large load tariffs was compiled in partnership with the North Carolina Clean Energy Technology Center.
China is accelerating its efforts to clean up heavy industry, allocating money for the first time last year to help hard-to-decarbonize sectors increase the use of fuels such as green hydrogen. The push comes as the country continues building more solar panels, wind turbines, and nuclear reactors and expanding its grid faster than anywhere else in the world.
Those two trends are converging to spur the greening of aluminum in particular — a commodity that requires so much power to manufacture that it’s nicknamed “congealed electricity.”
Aluminum production hit a record high last year in China as demand for the alloy, which is used in virtually every kind of electrical application, soared in tandem with the country’s data center boom, according to numbers the National Bureau of Statistics released in January. Prices of the globally traded commodity have spiked by nearly 35% in the past year, meaning that aluminum produced with clean electricity, which comes with a green premium, is more competitive.
At the same time, Beijing’s latest policies to steer its world-leading aluminum smelters away from coal are just taking effect. While the most recent national statistics showed steel production at a seven-year low — a result of the shift away from housing construction — analysts say the surging demand for aluminum could speed up the pace of that industry’s transformation.
“I do expect green aluminum production to pick up, even as other commodities retrench,” said Xinyi Shen, the head of the China team at the Centre for Research on Energy and Clean Air, a Finnish nonprofit that tracks Chinese heavy industry. “In China, aluminum decarbonization is progressing … showing stronger policy momentum than steel at the moment.”
There are limits to how quickly the shift can take place. China has for the past decade maintained a cap on aluminum production to prevent smelters from oversupplying and destabilizing the power grid. New production to meet surging demand is quickly approaching that limit, according to a December analysis from the bank ING. But already, the industry is starting to reorient production toward decarbonization.
One way China’s aluminum industry is going green is through recycling. Producing secondary aluminum requires only about 5% of the energy needed to produce primary aluminum, meaning that carbon emissions are typically up to at least 80% lower. Between 2015 and 2024, China’s recycled aluminum output grew by about 6.25% per year, reaching nearly 11 million metric tons in 2024. In March 2025, Beijing set a target of more than 15 million tons of recycled aluminum by 2027.
“This pathway is already cost-competitive and relatively insulated from power-price volatility, so it’s likely to keep expanding even in a softer macro environment,” Shen said.
The other way is by transitioning existing smelters to using clean power. Since nearly 70% of primary aluminum production relies on coal-fired or natural-gas-fired power plants, the sector produces about 2% of global greenhouse gas emissions. The rest is largely powered from hydroelectric dams, next to which older smelters were traditionally sited.
The power-intensive smelting process involves blasting a molten bath of cryolite with an electrical current that separates out dissolved aluminum and yields a molten metal that can be cast into ingots, billets, or bars. In China, where most of the world’s aluminum is produced, the vast majority of that electricity has historically come from coal. Under its new regulations, Beijing wants most of the power that smelters consume to come from renewables.
Last year, aluminum became the first energy-intensive industrial sector subject to a new renewable power mandate requiring green electricity to supply 70% of smelters’ electrons, up from just over 25%.
“Compliance is expected to be met increasingly through green power contracts and renewable-energy certificates, partly in response to both China’s domestic climate goals and emerging international green trade standards,” Shen said.
China has begun shifting its smelting capacity to provinces with excess hydropower or room for wind and solar arrays to offset coal- and gas-fired production.
Even before Beijing mandated that aluminum producers use more renewable power, smelters were already “looking at moving to hydro-rich regions” such as Yunnan province, David Fishman, a Shanghai-based analyst who tracks the Chinese electrical industry at the Lantau Group consultancy, wrote in a thread on X last month.
Wind and solar trailed behind hydropower, nuclear, and coal in the list of the lowest retail power prices in China, Fishman wrote. But he said that buying renewable energy credits was just as valid a solution if those certificates come from vetted, reputable sources in places with expanding production, such as Inner Mongolia or Xinjiang. Still, he noted, relocating to renewables-rich regions “isn’t just about cheap power.”
“It’s also about reducing uncertainty around long-term compliance with rising clean power quotas, which is becoming a C-suite level strategic variable,” Fishman wrote. “This is as true [if] you’re moving the smelter to Yunnan (for all its hydropower) or Xinjiang (where you’re going to have to pursue a wind/solar solution).”
A big open question is whether Chinese companies will start operating new smelters in other countries, and whether those facilities will be powered with renewable electricity, said Seaver Wang, the director of the climate and energy team at the Breakthrough Institute, a research nonprofit in California.
“The next big story in global aluminum is whether Chinese firms start developing overseas, particularly in Indonesia and Vietnam,” Wang said, noting that Indonesian advocates he’d spoken to feared that the facilities would use coal. “With aluminum capacity in China capped, where is the industry spilling over into?”
Rising demand globally for lower-carbon products is spurring on Chinese industry. That’s particularly true now that the European Union’s carbon tariff — the first in the world — took effect in January. Brussels is considering establishing a way to selectively exempt industries from the levies. But the bloc has so far vowed to keep requiring importers to buy carbon certificates to offset the emissions produced during manufacturing.
The China Nonferrous Metals Industry Association rolled out updated rules last year for the certification and trading of “green electricity aluminum,” in a move Shen said was “intended to ensure that low-carbon aluminum carries recognized commercial value in the market, rather than being merely a reporting label.”
Last summer, a Chinese steelmaker scheduled its debut shipment of green steel to a buyer in Italy, carving out the start of a supply chain that would comply with the EU’s carbon tariff. In November, top steel trade associations in Europe and China agreed to work together to create uniform standards for what qualifies as green.
If China’s experience with solar panels and batteries — in which its efforts to meet domestic demand led to a flood of cheap exports — is any indicator, the global market could soon have an influx of green aluminum.
Geothermal startup Quaise Energy is pushing to build out its first “superhot” power plant this year as more money flows to next-generation geothermal projects.
The Houston-based company says it’s developing a 50-megawatt plant in central Oregon that will tap into significantly hotter geothermal resources than its competitors do, using the firm’s novel rock-melting technology. Quaise broke ground on that site, called Project Obsidian, last year and plans to drill a well this year that will allow it to validate the subsurface conditions, which are expected to reach over 300 degrees Celsius (572 degrees Fahrenheit).
“That’s really in full swing in Oregon,” Harry Kelso, the communications manager for Quaise, told Canary Media.
Quaise is seeking $100 million in Series B financing to support its first commercial plant in Oregon, as Axios first reported last week and Kelso confirmed. The company is looking to secure another $100 million in grants and debt for the project, which it plans to bring online by 2030. It has already signed a power-purchase deal for the initial 50 MW with an undisclosed customer and is working to ink agreements for an additional 200 MW in future capacity, he said.
Eight-year-old Quaise is riding the wave of interest in cutting-edge geothermal technologies.
The United States is clamoring for new sources of electricity, particularly from projects that can produce power around the clock and without carbon emissions. Next-generation geothermal, a broad umbrella that includes a variety of improvements on conventional systems, promises to deliver that — but the sector is still in the early stages of development.
Already this year, investors have closed major funding rounds for startups Sage Geosystems and Zanskar. Fervo Energy, which aims to bring an initial 100-MW enhanced geothermal system online in October, filed for an IPO in January. Just last week, the Department of Energy announced $171.5 million in funding to support field-scale tests of next-gen technologies.
Strong Republican support for the industry also spurred Congress last year to keep tax credits in place for geothermal, even as the Trump administration revoked incentives for wind and solar.
This year “is by far the most exciting time for geothermal in a while, because you have an insatiable need for power,” said Curtis Cook, founder and CEO of Rodatherm Energy Corp., referring to demand from data centers and electrification more broadly. His Salt Lake City–based geothermal startup closed a $38 million Series A funding round last fall to develop its “closed-loop” geothermal pilot plant on federal lands in Utah.
As more startups advance projects this year, potential investors and lenders will gain a better understanding of the capital and operating expenses associated with these emerging technologies. “That’s an inflection point for meaningful growth within the industry,” Cook said.
In Oregon, Quaise’s Project Obsidian will initially use conventional drilling tools to begin building an enhanced geothermal plant near the Newberry Volcano. This approach involves fracturing rocks and pumping them full of water to create artificial reservoirs, which harness Earth’s heat to drive steam turbines on the surface.
Fervo and the government-backed Utah Forge initiative are also developing enhanced systems. But Quaise says it could be the first to operate a commercial plant in superhot rock. These resources are not only dramatically more efficient at generating energy but are also widely available — so long as your equipment can withstand the scorching and corrosive conditions.
To that end, as early as next year, Quaise aims to start deploying its novel millimeter-wave drilling techniques at its power plant. The technology uses high-frequency beams to melt and vaporize rocks, with the goal of accessing hotter resources that are typically found several miles below where traditional drilling equipment can reach.
Quaise has raised a total of $120 million so far from investors to accelerate testing and development, including from Mitsubishi and the oil-and-gas drilling contractor Nabors Industries.
Last year, Quaise said it successfully used its tech to drill to a depth of around 330 feet at a test site near Austin, Texas. Now, it’s gearing up to drill to nearly 3,300 feet later this year. For context, that’s less than half as deep as the vertical wells at Fervo’s first project, a 3.5-MW enhanced geothermal plant in Nevada. But Quaise says it’s working to advance the technology and reach depths of 16,000 feet and far below at the Oregon site.
“We’re bringing those two factors together — superhot geothermal and the drilling technology — so that we can do this just about anywhere” in the world, Kelso said. “That’s the whole ambition, and why this year is so important.”
This story was originally published by CalMatters. Sign up for their newsletters.
If you’re a California homeowner and you’ve been feeling chilly this winter, there are plenty of reasons to go get a heat pump.
An all-electric, energy-efficient alternative to gas-burning furnaces, heat pumps are widely seen as the climate-friendly home heater of choice.
They can do double duty as both home heaters and AC units and are pretty good at maintaining a constant temperature inside a home without the blast-then-cool-off cycle typical of a furnace.
What about a guaranteed lower monthly utility bill? Not in California.
Call it California’s heat pump conundrum.
On the one hand, California has hyperambitious goals to reduce greenhouse gas emissions in an effort to curb the worst effects of a changing climate. Most experts see the electrification of buildings — swapping furnaces, water heaters, stoves, and ovens that run on burning fossil fuel with appliances plugged into California’s increasingly green electrical grid — as a necessary step toward meeting those goals.
California has built one of the most aggressive heat pump strategies in the country. The state aims to install 6 million heat pumps in homes by 2030. Lawmakers are also moving this year to boost heat pump adoption — proposing to streamline permitting and make it easier to electrify homes.
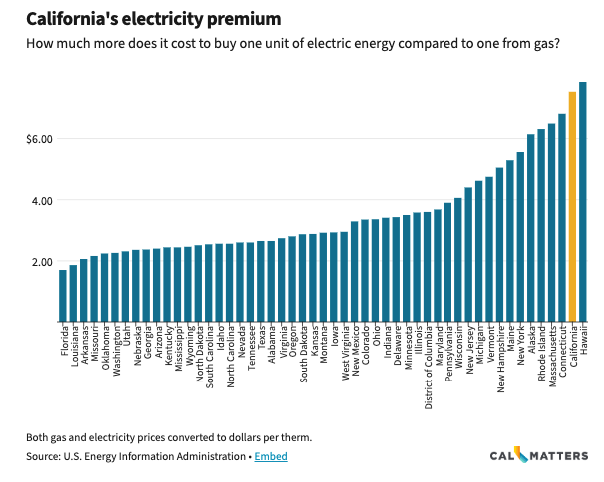
On the other hand, California’s residential electricity prices are among the highest in the country — expensive even compared to its also pricey natural gas. That makes heat pumps a tough sell to many Californians.
A new Harvard University study maps exactly where that reality bites — and tries to explain why some places are more heat-pump friendly than others.
The public is “overwhelmed with these sorts of plans now for decarbonization: ‘This by 2030,’ ‘this by 2050,’” said Roxana Shafiee, an environmental science policy researcher at Harvard University. “But then you scratch the surface a bit more and you look at things like electricity prices.”
Reaching those goals amid such high prices is a tough circle to square, said Shafiee.
By looking at residential energy costs, usage, and winter temperatures in every county in the United States, Shafiee and Harvard environmental science professor Daniel Schrag found in a recent paper that typical households living across the American South and the Pacific Northwest would likely see lower utility bills by making the switch to a heat pump.
Average homes in northern Midwestern states, in contrast, would see their bills increase. That’s partly because heat pumps work by extracting heat from outdoor air, compressing it, and piping it indoors, a thermal magic trick that’s harder to perform in places with subzero winters. It’s also thanks to the region’s relatively cheap gas.
Then there’s California: a surprisingly mixed bag.
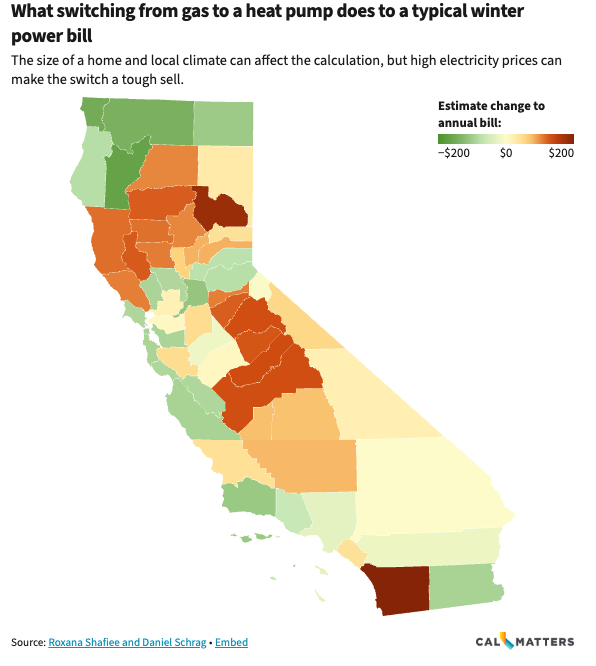
Though the state’s temperate coast is ideal for heat pump adoption, high residential electricity prices can make swapping a gas furnace for a heat pump a pricey proposition. That’s especially true in counties where homes tend to be larger, winters are colder, or electricity is costly.
Quentin Gee, a manager at the California Energy Commission, said the advantage of heat pumps comes down to thermodynamics. Unlike a gas furnace, which burns fuel to create heat, a heat pump compresses and expands a refrigerant, like a refrigerator in reverse. That moves heat from outside into a home — allowing it to deliver several units of heat for every unit of electricity it uses.
Even in Pacific Gas & Electric territory, where electricity rates may be some of the highest in the U.S., Gee said that efficiency can allow heat pumps to compete with — and in some cases beat — gas on operating costs, depending on local rates and home characteristics.
In lower-cost municipal utility regions such as Sacramento’s Sacramento Municipal Utility District, he said heat pumps can be a clear financial win.
“Gas prices have also gone up over time as well — so both are tricky when it comes to heat pumps versus, say, a gas furnace,” Gee said.
Between 2001 and 2024, average retail gas prices have gone up by 80% in California, according to federal data. Retail electricity rates, padded out with wildfire prevention costs and state-mandated social programs, have increased by twice as much.
Even in parts of California where the average home isn’t likely to save with a heat pump, there are plenty of exceptions. Smaller, well-insulated homes can often stay warm with minimal output from a heat pump.
For some homeowners, solar panels have helped bridge the gap. Doug King, a green building consultant in San Jose, installed his first heat pump in 2021 alongside a new rooftop solar system; those panels more or less covered the monthly cost of running the heat pump. A second unit installed last year has pushed his bills higher. “But that’s fine, I don’t mind,” he said. “I was willing to pay a bit of a premium for using electricity over gas anyway.”
Homes that already use old-fashioned electrical baseboard or space heaters are guaranteed to save on monthly costs by switching since that entails swapping an inefficient electrical heating system that uses a ton of energy (“basically like heating your home with a toaster,” said Shafiee) for heat pumps that use up to 60% less.
But for all of California’s reputation as a climate champion, most of its homes don’t rely on electric heat. Nearly two-thirds use natural gas, well above the national average of 51%.
That isn’t surprising, said Lucas Davis, a University of California, Berkeley, energy economist.
Looking at 70 years of home heating data across the country, Davis’ research has found that the best predictor of whether a household uses electricity to stay cozy in the winter is the price of energy.
“To this day, where do we see that electric heating is the most common? Throughout the Southeast,” said Davis. “What do we know about the southeast? Cheap electricity.”

The consequences of costly electricity extend well beyond any individual household’s ambitions for a heat pump or its utility bill. Using fossil fuels to heat up water, warm indoor air, and cook food inside homes and businesses was responsible for 13% of the country’s greenhouse gas emissions in 2022, according to the U.S. Environmental Protection Agency. Gas-powered cars and trucks used for private use make up another 16%.
Heat pumps are a 19th-century invention and started popping up regularly in American homes in the 1960s, but you would be forgiven for thinking they’re a new technology.
Spurred on by concerns over climate change and policies meant to address it, heat pumps have outsold gas furnaces each year since 2021, according to the Rocky Mountain Institute, a clean-energy research nonprofit. Demand saw a particularly sharp spike after 2022 thanks to the Inflation Reduction Act, the Biden-era law that threw rebates and tax credits at homeowners.
Installation costs can reach into the tens of thousands of dollars, which is why most federal and state policies promoting heat pump adoption have focused on defraying them. In California, the push runs through multiple agencies:
This year, state lawmakers are considering bills to speed up the local permitting process for heat pumps and to require gas utilities to offer homeowners cash to electrify their homes in lieu of replacing an old gas line.
Even as the federal supports subsided with President Donald Trump’s return to the White House, installation costs are “pretty competitively priced with traditional units, especially since in most cases, you are installing two appliances for the price of one,” said Madison Vander Klay, a California policy advocate for the Building Decarbonization Coalition, a national nonprofit which represents appliance manufacturers and utilities.
That may not be the case for all homeowners.
Many homes need new wiring, larger breakers, or a full panel replacement, and some require upgrades to the service connection to the grid, said Matthew Freedman of The Utility Reform Network. Costs rise quickly when homeowners electrify more than just heating, he said.
Customers often underestimate how complex and costly that electrical work can be, he said, another uncertainty on top of the potential for long-term rate savings.
Installation costs aside, month-to-month electricity costs remain an obstacle.
Last year, the Legislative Analyst’s Office released a report warning that California’s residential electricity rates are among the highest in the country — nearly double the national average — and rising much faster than inflation.
The report, authored by LAO analyst Helen Kerstein, cautioned that those high rates could undermine the state’s climate strategy by discouraging households from switching to electric cars and appliances like heat pumps from gas-powered ones.
“If I’m a consumer, I’m going to be thinking about — not just, ‘Is this good for the environment?’ That’s certainly one consideration, but also, ‘Is this something I can afford?’” Kerstein said. “Unless folks are saving money on the operating cost, it often doesn’t pencil out.”
An upheaval is underway in the nation’s electricity sector, and Virginia is ground zero. As the data center capital of the world, the state faces surging demand, ballooning utility bills, and a bottlenecked grid — all challenges that policymakers are navigating while maintaining a legally mandated course toward carbon neutrality.
Now, the state is poised to become the first in the nation to quantify and examine ways to reduce waste on the electric grid — a potentially monumental move toward reining in rates and speeding the clean energy transition. Maximizing usage of our existing network of power lines and related infrastructure, backers say, could also help close the gap between the public interest and that of investor-owned utilities.
House Bill 434 would direct Appalachian Power Co. and Dominion Energy, the state’s two predominant vertically integrated utilities, to gather and report detailed data on their grid utilization. The measure won final approval from Virginia’s Democratic-controlled legislature this week and now heads to the desk of Gov. Abigail Spanberger — a Democrat whose victory in November was fueled in part by anxiety over rising electricity costs. As one of the earliest proposals Spanberger offered after her election to address energy affordability, the bill looks certain to become law.
Many experts say the information the measure would require is itself meaningful: Utilities have long resisted gathering and reporting such metrics, in part because doing so could hurt their case to build out more infrastructure that pads their bottom lines.
But advocates for HB 434 say its real impact could come after the utilization data has been reviewed by regulators, who must then establish a timeline for utilities to optimize grid usage. The bill directs officials to give special consideration to “non-wires alternatives” like batteries and line sensors.
“The fact that Virginia became the first state to introduce this sort of legislation is pretty significant,” said Charles Hua, the founder and executive director of PowerLines, a nonprofit that aims to lower utility bills and supports HB 434. “But this would just be the first step of a long journey.”
The legislation is premised on an incredible reality: Roughly half the electric grid goes unused about 99% of the time. Poles, wires, substations, and other components are built out to deliver electrons during periods of maximum demand, such as during the recent cold snap brought on by Winter Storm Fern. But those peak events are rare.
“This is where this conversation has been stuck for 20 years,” said Pier LaFarge, the co-founder and CEO of Sparkfund, which helps utilities deploy and manage distributed energy sources. “We’ve built the grid to peak … then said, ‘How much space is left?’ But what’s amazing is, the grid only is at peak 50 to 200 hours a year out of 8,760.”
Another factor is that some kilowatt-hours are lost as they travel from the point of generation to the customer, especially along lower-voltage AC distribution lines.
“Local poles and wires, that is, the distribution grid, is really not that efficient,” Hua said. “But you never would really know, because there’s not a ton of transparency around spending.”
HB 434 would prompt Appalachian Power and Dominion to examine and quantify these utilization gaps and inefficiencies as part of a regulatory proceeding this fall. The state’s utilities commission would then review and approve that data and direct the companies to increase grid utilization.
The measure requires regulators to evaluate key technologies — from energy storage to synchronous condensers, which reduce line loss — to improve use of the grid. It also opens the door for regulators to weigh grid utilization when considering utility proposals to instead expand their infrastructure.
In theory, these steps should lead to lower rates for customers. “Electricity rates are a math equation,” Hua said, where the top of the fraction is the cost of grid infrastructure, among other investments, and the bottom half is the number of kilowatt-hours sold.
Increasing grid utilization divides the fixed cost of the poles and wires — roughly the same numerator — by more electrons, a much higher denominator. “Therefore, you’re lowering the per-unit price of electricity,” Hua said, “and you’re lowering utility bills for all consumers.”
Exactly how significant this “denominator effect” will be isn’t clear yet – not without the data HB 434 requires utilities to compile. But experts say that growing the bottom of the fraction is a win for both customers and the investor-owned utilities, which make more money the more kilowatt-hours they sell.
Grid optimization also gives these utilities a pathway to making capital investments that earn them a guaranteed profit more quickly than building new power plants. That pathway runs through grid-scale batteries, according to LaFarge.
“Batteries have enormous value to the grid because they’re electron time machines. You can charge them up when there’s plenty of energy on the grid and no congestion or scarcity,” LaFarge said, and then discharge them when demand is at its height. “It creates more room on the grid using the grid you have. That unique nature of batteries is their superpower.”
While storage technology has been around for a decade, until very recently it was more expensive than building poles and wires and harder to justify to regulators.
“What has changed in the last 18 to 24 months is batteries have gotten staggeringly cheap,” LaFarge said, and utilities can invest in them and improve their bottom lines. “This is one of our most important messages around utilization: Utilities can earn more on capital assets [and] have higher revenue while delivering cheaper power to people.”
LaFarge’s company has worked with Dominion on other forms of distributed generation, including EV charging. For batteries, he said, “the Virginia utilization bill certainly creates an even bigger opportunity.”
To be sure, increased grid utilization is far from the only step Virginia lawmakers can take to tamp down skyrocketing electricity costs. Tying rates to performance metrics such as affordability and efficiency, increasing targets for batteries and other cheap sources of clean energy, and enabling more large-scale solar projects are among a host of legislative proposals that would also help lower prices — and that all could also become law this year.
It’s also true that the one-page HB 434 is more suggestion than mandate, and its speedy passage through the Virginia General Assembly — including by a nearly unanimous vote in the House of Delegates — raises questions about its impact. And the onus will be on the state’s utilities to measure, report, and improve grid utilization, albeit with prodding from regulators.
Still, Jigar Shah, a longtime energy entrepreneur and the director of the U.S. Department of Energy Loan Programs Office under former President Joe Biden, believes the legislation will put utilities on the hook, even as it gives them leeway to collect and analyze utilization data.
“What’s not acceptable is for folks to say, ‘It’s not possible and rates are going up 9% a year,” said Shah, who helped shape and advocate for the bill as an adviser to the nonprofit Deploy Action. He also pointed out Spanberger’s support and regulators’ engagement in the bill.
“It’s not something that we expect to be buried in a [utility] filing and it goes to die,” he said. “I think there’s actual interest in it from folks on the commission to continue moving it.”
For LaFarge, the broad consensus around the legislation is a reason for optimism, not skepticism.
“This is a bipartisan idea that really is having its moment, and we’re excited to see the successes of this bill replicated in dozens of states,” LaFarge said. “I think the regulated utility compact is about to surprise people with its ability to solve these problems to the benefit of the climate, the economy, and people who use energy in their daily lives.”
Disclosure: Charles Hua is a member of Canary Media’s board of directors. The board has no influence over Canary Media’s reporting.
Artificial intelligence’s bubblitude fizzes with circular transactions, risk concealment, and exotic real-estate debt finance. In a frenzy to build AI data centers, Big Tech recently borrowed and bonded more money in 11 weeks than in the previous three years combined. More than a thousand new data centers are under construction or planned nationwide. Though they don’t yet know how many of those facilities will eventually materialize, energy suppliers are using AI data centers’ ravenous appetite for electrons to justify vast new investments in gas and nuclear power plants and the revival of uneconomic coal plants, claiming that all are needed to win the AI arms race and keep the lights on.
This trillion-dollar surge is transforming not only equity and capital markets but also the future U.S. power mix, locking in decisions that will shape energy affordability for decades. Smarter, cheaper, cleaner, less-risky options for powering data centers exist — if decision-makers choose them.
To meet all the expected new electricity demand, the U.S. has rapidly proliferated its gas-fired capacity under development in 2025. For context, at the start of 2024, only 4 gigawatts of gas-fired power in the U.S. development pipeline were explicitly earmarked for powering data centers. Today, over 100 gigawatts are.
And developers are proposing to invest over $400 billion to build more than 250 gigawatts of new U.S. gas-fired power plants — nearly tripling the gas power pipeline in a year, mostly driven by speculative AI projects subsidized by 37 heavily lobbied state governments.
Some data centers are even being mandated as “critical defense facilities” to be built on federal land, alongside otherwise uneconomical nuclear plants exempted from strict Nuclear Regulatory Commission scrutiny, all at taxpayer expense. This is happening, ironically, in Texas — the nation’s free-enterprise leader in solar, wind, and batteries. These renewable resources totaled 97% of its 2025 capacity additions, while fossil fuels amounted to 3%, and nuclear 0%. But in the past two years, planned gas plants in Texas nearly quadrupled, to 80 gigawatts. Only China has more gas plants under development than Texas, and nearly half the Texas plants are meant to power data centers directly.
We’ve seen this movie before. A quarter century ago, the coal industry warned that the Internet would overwhelm the grid without massive new coal capacity. Demand proved to be over tenfold lower. The dot-com bubble burst in 2000, permanently vaporizing $120 billion of electricity investments and embalming another $80 billion in infrastructure built long before it was needed. Today’s AI mania rhymes: Gas and nuclear vendors that can’t beat energy efficiency and renewables in competitive markets are leveraging hype into mandates and subsidies to rescue their losers.
Yet capital markets increasingly fear that AI looks like a bubble set to pop. That’s because each new data center effectively bets against at least 10 plausible outcomes that make the investment unwise: Scaling large language models could fail to achieve superintelligence; customer revenue could disappoint; inaccuracy may persist; smaller and leaner models might keep outperforming giants; copyright infringements may have to be paid for; data centers may go on quadrupling their energy efficiency every year; and flexible interconnection might stretch existing grid assets to serve all new demand.
Each new power plant also bets against the ways that data centers may access cheaper electricity, such as adding pop-up microgrids, colocating renewables and storage at idle gas plants, and buying efficiency, flexible load, storage, and clean supply from other customers. Betting against any one of these realities is risky. Betting against all of them strains credulity.
Many utilities are already trimming projections toward reality. Regulators in data-center hot spots are scrambling to shield customers from accelerating and politically sensitive rate hikes — already up 16% in Illinois, 13% in Virginia, 12% in Ohio, and 6% nationwide. Meanwhile, actual data-center demand still barely shows up in national totals. U.S. weather-adjusted electricity use fell in 2023, then rose by 2% in 2024, about one-twentieth due to new data centers. Nearly all the growth comes instead from air conditioning, electrifying buildings and vehicles, and reshoring industry. These needs can all be more cheaply met by better efficiency, and by another vast and potent competitor to fossil fuels: renewables.
Globally, data centers — roughly one-ninth of which are devoted to AI — use about 1.5% of today’s electricity. The International Energy Agency forecasts they’ll grow in this decade while renewable supplies grow 11 times more. Thus, solar and wind power, now swiftly displacing costlier fossil-fueled and nuclear power, dwarf the AI boom. Speed to market is paramount for AI developers, so many smart tech companies choose renewables to get their data centers built and running quickly and cheaply.
However, other AI firms have rushed for gas power, and that stampede has doubled gas-plant costs and backlogged gas turbine deliveries to past 2030, to the point that two-thirds of gas-plant project proposals have no named turbine manufacturer. This jam has pushed about a fifth of projects to substitute off-grid gas power, often using adapted aircraft jet engines. These turbine generators are easily available but engineered to meet peak demand, so they’re inefficient, noisy, and dirty. Running them constantly to power data centers would quickly inflate electricity costs and magnify public health damages. U.S. data centers were already projected to cause more than $20 billion per year in asthma and cardiopulmonary disease costs by 2030. Communities will not welcome additional pollution, water stress, noise, and rate hikes.
Gas markets magnify the financial risks of turning to gas to power data centers. New gas wells decline faster than old ones, while falling oil prices can make new drilling and refracking unattractive. At the same time, exuberant exports of liquefied American gas (and gas pipelined to Mexico) are pushing gas toward both global glut and domestic scarcity. The analysts at BloombergNEF predict that new gas-fired AI power could tip the 2025–30 U.S. gas surplus into a deficit, making volatile gas prices for heating, industry, and utilities spike. Indeed, BloombergNEF says wholesale gas futures for 2028–30 are unsustainably priced below production cost. And whatever the gas price, new gas-fired power plants are likely to become underutilized, subsidized assets that burden electricity customers long after today’s AI ebullience fades. While many data centers will be built, many won’t, and many won’t actually run at full tilt for decades to come — stranding gas plants and pipelines built to power them.
Even as national policy reinforces a gas lock-in, power choices that can scale at AI speed already dominate actual markets. Renewables captured over 92% of the world’s new generating capacity in 2024 and (including storage) about 90% of U.S. additions in 2025, with 93% expected in 2026. They are far cheaper than gas power, keep getting cheaper, sell on constant-price contracts for decades, and finance like low-risk annuities. They’re virtually unlimited and deploy at industrial speed.
Last May, China added 1 gigawatt of solar and wind power roughly every six hours around the clock. Pakistan displaced 30% of its utility power with solar in four years. Vietnam added solar equivalent to half of its coal generation in two years. South Australia generates 75% of its annual electricity from renewables and will reach 100% by 2027, driving 37 firms to propose relocating there to secure stable, low-cost power. Global metals giants Rio Tinto and BHP are relying on “renewable baseload” power to smelt aluminum and mine copper. Apple’s data centers have run on fully renewable energy for more than a decade. Google just announced that on-site solar, wind, and battery power will get its new 850-megawatt Texas data center online in 18 months, not five-plus years.
Critics have long claimed that variable renewables are too unreliable: The wind doesn’t always blow, and the sun doesn’t always shine. But evidence shows that intermittency concerns are now generally unfounded. Ten proven carbon-free balancing methods already make high-renewable grids reliable and economic in many countries. One of those methods, batteries, costs 96% less today than it did in 2010. BloombergNEF finds that battery-firmed solar and wind deliver steady power more cheaply than any new fossil or nuclear plants, and many operating ones. That’s why three-fourths of India’s new firm capacity today is solar-plus-storage.
Renewables also offer essential speed. In Sparks, Nevada, the world’s largest solar-powered microgrid continuously powers modular data centers. Solar panels laid on desert ground feed hundreds of second-life electric-vehicle batteries joined to form a superbattery. It was all built in four months and delivers electricity that’s cheaper, quieter, and more reliable than grid power; uses virtually no water; emits nothing; and is even portable. This is what clean, scalable, market-speed power looks like. Gas isn’t it.
AI does have some valuable applications. No one yet knows, though, if its revenues can repay the immense and swiftly depreciating investments required. But while markets are answering that trillion-dollar question, the AI boom must not be allowed to undermine American energy affordability and security.
Utilities and regulators can protect existing customers with a simple safeguard, giving teeth to vague qualitative pledges: Sell power to new data centers only under “take or pay” contracts that repay the entire electricity investment regardless. Those agreements should be backed by robust bonds or insurance, priced by capital-market risk experts (not by developers), to ensure that if an AI venture collapses, losses fall on the developer, not on households and small businesses.
If markets, and not mandates, determine the outcome, the conclusion is already clear. Gas, coal, and nuclear are too slow, too costly, and too risky to anchor the next wave of U.S. power demand. The only technologies that scale quickly enough, cheaply enough, and reliably enough for AI already dominate global additions. Policy will now decide whether Americans will enable the new energy system or protect the old — and whether they’ll pay for stranded gas plants or profit from the cheapest and most secure electricity in history.

.svg)
